

If you are thinking of starting your own business or have already started one, sooner or later you will face questions such as:
- What is my burn out rate?
- Will I be able to afford to hire a sales director?
- How many customers do we need to break-even?
- How much does my company cost?
In order to answer these and many other questions, you need to have a financial model in place. More importantly, if you need to raise further funds to grow your company, a financial model is something which will prove invaluable.
As Winston Churchill once put it:
“Plans are of little importance, but planning is essential.”
The same applies to a financial model. It doesn’t have to be precisely correct, however it does need to show that you, as a founder, know exactly how your business operates and what you are trying to achieve.
There are different templates available on the web for financial modelling, however, in my opinion, using someone else’s template is like wearing someone else’s suit – it just doesn’t feel right. If you want to feel comfortable you need to have one tailor-made just for you.
A good financial model has the following components:
- Budget (monthly or quarterly)
- Assumptions for revenue and cost
- Projected financial statements (balance sheet, income statement, cash flow and statement of equity)
- Headcount or hiring plan
- Working capital assumptions
- Key metrics
- Sensitivity analysis
If you don’t have a financial background, the five easy steps listed below should be enough to get you going and prepare the first part of the financial model, the budget, which is a great starting point for drafting financial statements and other key financial and operating metrics.
The five steps
1 – Start gathering actual data
When starting a business, you may feel that keeping track of your expenses is an arduous and boring task. However, I would highly recommend that you remember, (no matter how boring it sounds) to separate your business expenses from your personal ones! Get a separate credit card, separate bank account – whatever works best for you – but make sure you keep everything separate, it’s highly important! After this is done, start collecting all of your business expenses’ receipts and invoices and inputting them into a simple Excel table which might look like this:
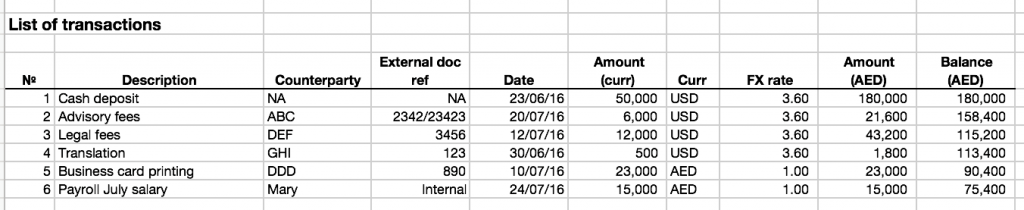
It is very crucial to add a date column, where you input the dates stated on your receipts and invoices, which ideally highlight when the product was purchased or service was rendered.
2 – Simplify the presentation of your expenses by type
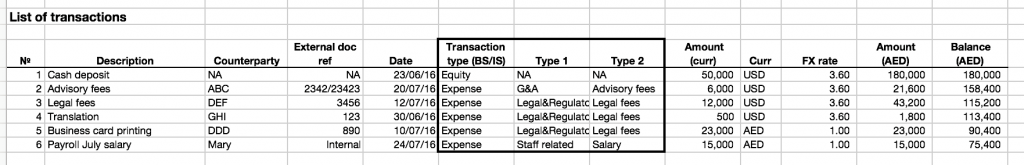
After the data is gathered, you need to add another column and classify all expenses into several categories. For a start-up company these are the main expenses that most likely will be present:
- Administrative expenses – office rent (probably in a shared area), stationery and subscription to admin software such as Dropbox, Microsoft, etc.
- Staff related expenses – salaries – this can also fall into the administrative expenses category, but due to its significance it is better to separate them
- Regulatory expenses – licensing, other legal fees, and notarial fees are significant in the first year, therefore also suggest to present them separately
- Selling and Marketing expenses – google ads, attending marketing events and PR campaigns, etc.
- IT costs – if you are a digital start-up, IT costs would constitute a major part of your profit and loss statement, therefore it is wise to present them separately as well.
After this exercise is done, your table might look like this:
3 – Accumulate your actuals by expense types and by periods (whether months or quarters)
This step simply means presenting your actuals in an aggregated format based on the expense types and periods. By using the Excel formula Sumif, your actual transactions will be accumulated and presented by expense types:
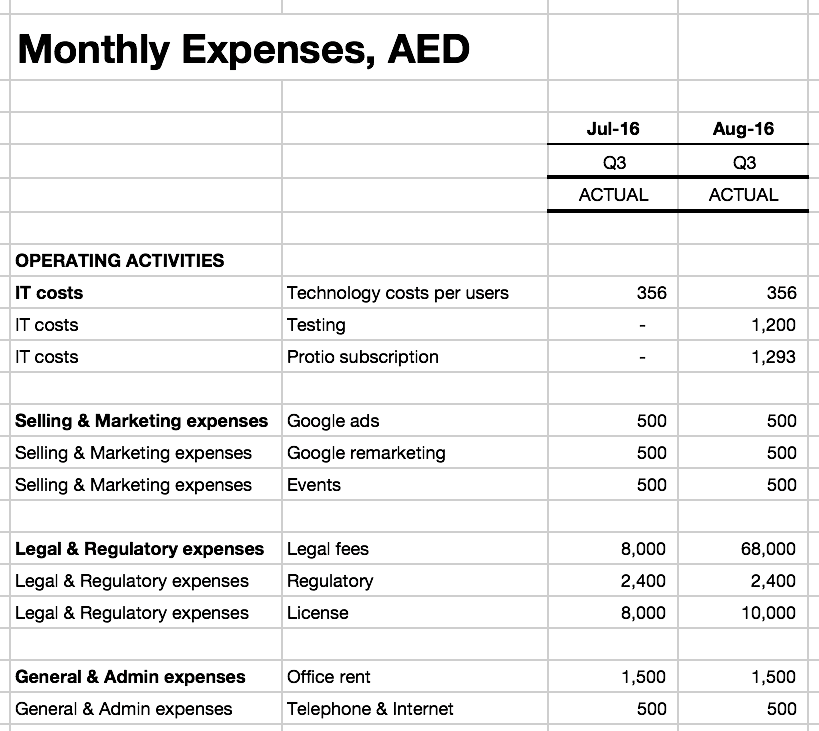
In this table, columns are months, meaning that this budget is prepared on a monthly basis. To do that, after the dates are inputted in step 2, by using Excel formula Month, they can be distributed to different months which they relate to.
4 – Start projecting your expenses and revenues for future periods
After you have finished inputting your data, it’s time for projections, which, in my opinion, is the most exciting part of financial modelling! If you have already incurred expenses, then it should be fairly easy to predict how much something will cost you later on. However, if there is a new expense – then you need to do some research on how much it will cost your business. And if you have no idea whatsoever on where to go for an answer – then you need to start making assumptions.
5- Accumulate assumptions
Create a separate sheet for assumptions where you will accumulate all data related to future expense and revenue drivers. One of the advantages to keeping them on a separate sheet, is that after you link them in your budget table, you can easily change your projected data by changing those assumptions. Another advantage is that it makes your calculations transparent for someone who wants to review them.
Assumptions can include the following:
- Growth rate or your customers’ number or projected customers’ number in absolute amounts
- Number of customers per sales agent
- Office rent per year
- Technology cost per user, etc.
After you have performed these 5 steps above, you will have a budget which will be a very important source of information for preparing projected financial statements, key metrics and valuation for your company.
Stay tuned to the blog for the rest of my “five easy steps” series, which will help you create the entire financial statement.